> ## Documentation Index
> Fetch the complete documentation index at: https://docs.ewake.ai/llms.txt
> Use this file to discover all available pages before exploring further.
# VictoriaMetrics
> Connect VictoriaMetrics to give ewake access to your time-series metrics for anomaly detection and root cause analysis.
**What you'll get:** ewake can query your VictoriaMetrics data with PromQL to retrieve metrics, detect anomalies, and correlate data points with alerts and deployments, without requiring manual query construction.
***
## Prerequisites
* A Grafana instance (Cloud or self-hosted) with a **VictoriaMetrics data source** already configured
* Admin access to create a Service Account in Grafana
Ewake reads VictoriaMetrics **through your Grafana data source proxy**, so you connect Grafana once rather than exposing VictoriaMetrics directly. Ewake resolves the data source automatically.
***
## Configuration
In Grafana, go to **Administration** → **Service Accounts** → click **Add service account**.
Set the role to **Viewer**, ewake only needs read access.
Once the account is created, click **Add service account token** → copy the token immediately.
Copy the token now, you won't be able to see it again after closing the modal.
**Grafana Cloud:** Your instance URL follows the format `https://yourorg.grafana.net`.
**Self-hosted:** Use the base URL of your Grafana instance (e.g. `https://grafana.yourcompany.com`).
In your ewake dashboard, go to **Integrations** → **VictoriaMetrics** → click **Configure**.
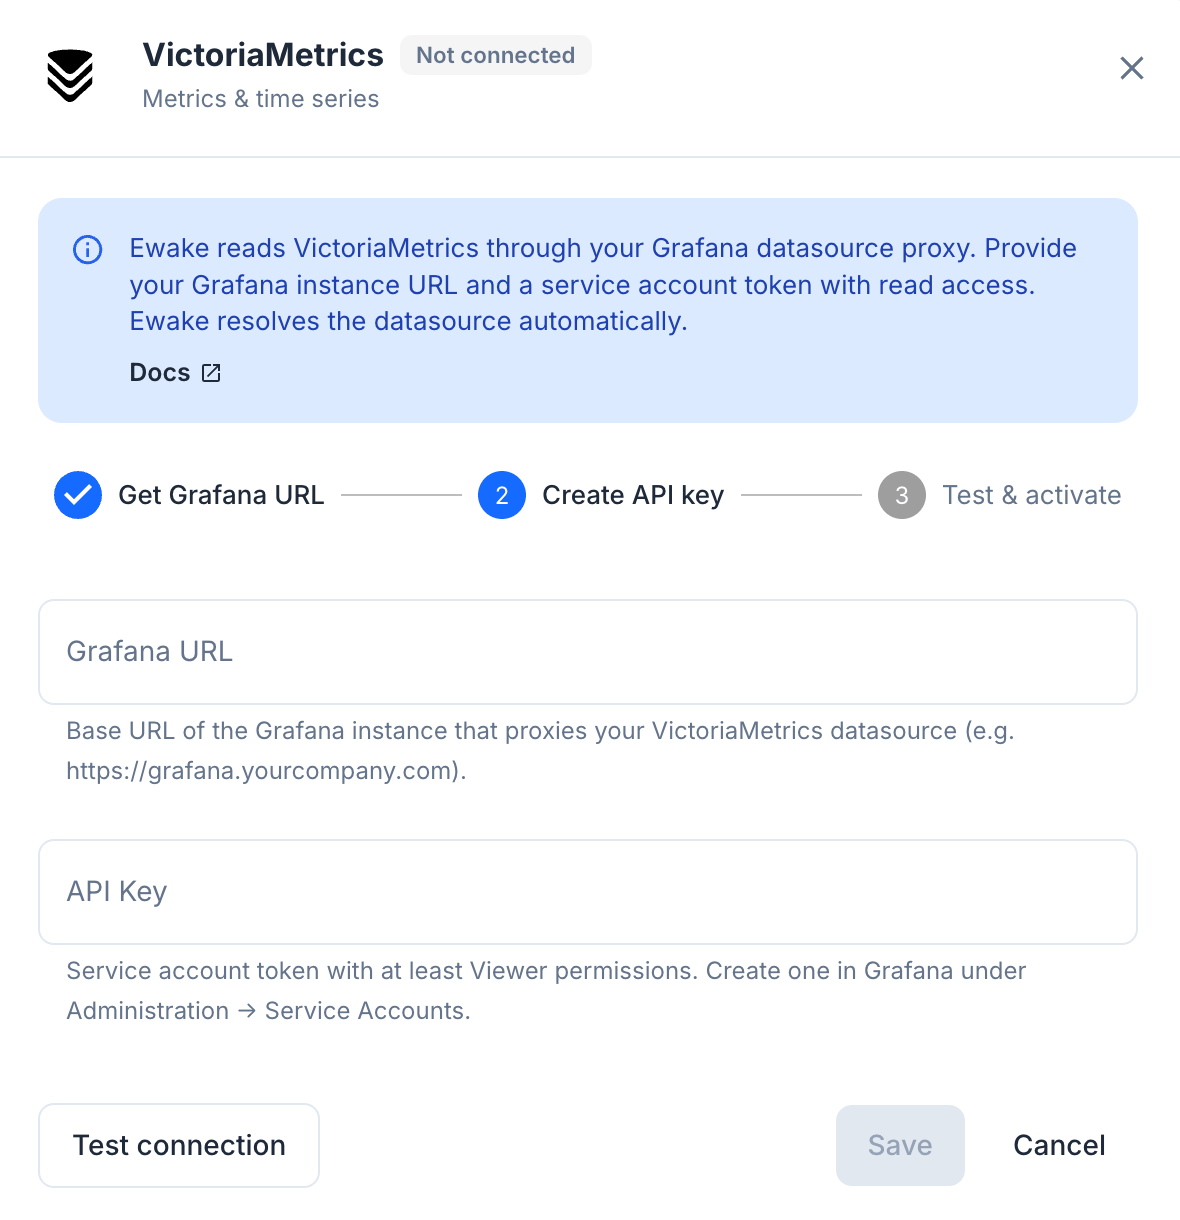 | Field | Value |
| --------------- | ------------------------------------------------------------------------------ |
| **Grafana URL** | Base URL of the Grafana instance that proxies your VictoriaMetrics data source |
| **API Key** | The service account token generated in Step 1 |
Click **Test Configuration** to verify the connection, then click **Save**.
VictoriaMetrics is connected. Ewake can now query your metrics during investigations.
***
Ewake uses **read-only** PromQL queries. It never writes metrics or modifies your VictoriaMetrics or Grafana configuration.
| Field | Value |
| --------------- | ------------------------------------------------------------------------------ |
| **Grafana URL** | Base URL of the Grafana instance that proxies your VictoriaMetrics data source |
| **API Key** | The service account token generated in Step 1 |
Click **Test Configuration** to verify the connection, then click **Save**.
VictoriaMetrics is connected. Ewake can now query your metrics during investigations.
***
Ewake uses **read-only** PromQL queries. It never writes metrics or modifies your VictoriaMetrics or Grafana configuration.