

What you’ll get: during an incident, ewake can inspect your cluster — list
pods, read their status and events, pull (and
--previous) container logs, and
see deployment state — to root-cause failures like CrashLoopBackOff,
OOMKilled, ImagePullBackOff, and unschedulable pods. You decide the access:
keep it read-only for investigation, or expose write tools, such as restarting a
pod, so ewake can act on your behalf.How it works
You run a Kubernetes MCP server inside your cluster and expose it over a tunnel of your choice. ewake connects to that endpoint — with whatever headers you specify — and reads pods, events, logs, and deployments on demand. ewake never needs inbound access: the tunnel dials out, so no ports are opened into your cluster. And ewake doesn’t ask for any particular access: what it can do is set by the tools your server exposes and the RBAC role it runs under.Configuration
1
Run the MCP server in your cluster
Deploy the open-source
kubernetes-mcp-server
however you prefer — Helm, plain manifests, or an existing deployment. Then
decide what ewake can do:- Investigate only — start the server with
--read-only(optionally--toolsets core,config) and bind its ServiceAccount to the built-inviewClusterRole, which excludes Secrets and all write verbs. - Investigate and act — run the server without
--read-onlyand bind its ServiceAccount to a role with only the write verbs you want ewake to use, scoped to the namespaces it should act on, for example restarting pods.
2
Expose it through a tunnel
Put the server behind an outbound tunnel so ewake can reach it without any
inbound ports — for example
Cloudflare Tunnel,
ngrok, or any equivalent. Protect the public endpoint with
whatever your tunnel offers (a Cloudflare Access service token, an ngrok auth
header, etc.).Your endpoint URL is the public tunnel hostname plus the MCP path, e.g.
https://k8s-mcp.yourcompany.com/mcp.3
Connect it in ewake
In your dashboard, go to Integrations → Infrastructure → Kubernetes →
Connect, then enter: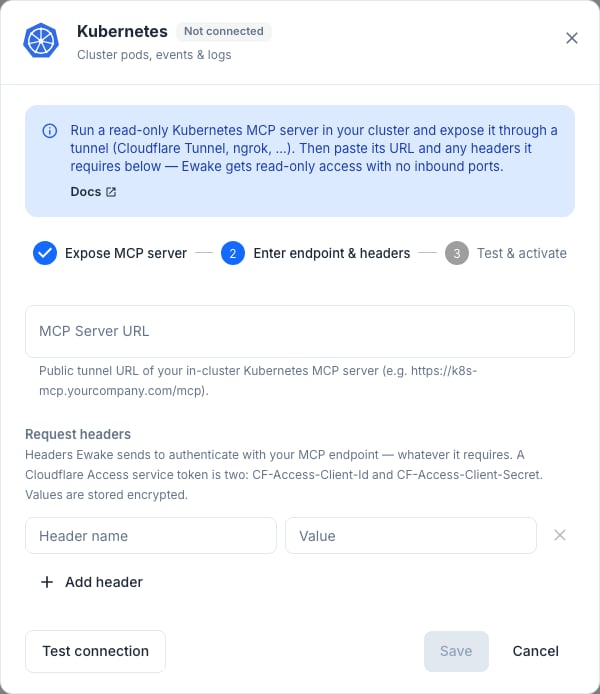
Headers depend on how you protected the endpoint:
- Cloudflare Access service token → two headers:
CF-Access-Client-IdandCF-Access-Client-Secret. - Bearer / ngrok → e.g.
Authorization: Bearer <token>. - No auth → leave it empty.
4
Test and save
Click Test connection — ewake connects through the tunnel and lists the
tools the server exposes to confirm the URL and headers work. Then click Save.
Kubernetes is connected. ewake can now read pods, events, logs, and
deployment state during incidents, and use any write tools you exposed.
Connect more than one cluster
Kubernetes is a multi-instance integration: connect as many clusters as you need, one at a time. Give each cluster a Cluster name that tells them apart in the dashboard, for exampleprod, staging-eu. Letters, digits, - or _, starting with a letter or digit, max 64 characters.
Each cluster keeps its own MCP server URL and request headers. Disconnecting one leaves the others untouched. They’re listed under Connected clusters in the integration dialog, where you can add another with Connect a cluster or remove one on its own.
What ewake can and can’t do
Investigate
List and describe pods, deployments, nodes, and events; read current and
previous container logs; inspect non-secret config.
Act, if you allow it
Restart pods, or take other actions, using only the write tools and RBAC
verbs you grant the server.
Never
Use access the server’s role doesn’t grant. Open any inbound port into your
cluster.
ewake observes your cluster on demand during an investigation — it does not
continuously watch or store cluster state.