What you’ll get: ewake can search your Tempo traces with TraceQL, inspect spans across services, and correlate latency or errors with alerts and deployments, without requiring manual query construction.
Prerequisites
- A Grafana instance (Cloud or self-hosted) with a Tempo data source already configured
- Admin access to create a Service Account in Grafana
Ewake reads Tempo through your Grafana data source proxy, so you connect Grafana once rather than exposing Tempo directly. Ewake resolves the Tempo data source automatically.
Configuration
Create a Service Account in Grafana
In Grafana, go to Administration → Service Accounts → click Add service account.Set the role to Viewer, ewake only needs read access.Once the account is created, click Add service account token → copy the token immediately.
Copy the token now, you won’t be able to see it again after closing the modal.
Get your Grafana instance URL
Grafana Cloud: Your instance URL follows the format
https://yourorg.grafana.net.Self-hosted: Use the base URL of your Grafana instance (e.g. https://grafana.yourcompany.com).Open the Tempo integration in ewake
In your ewake dashboard, go to Integrations → Tempo → click Configure.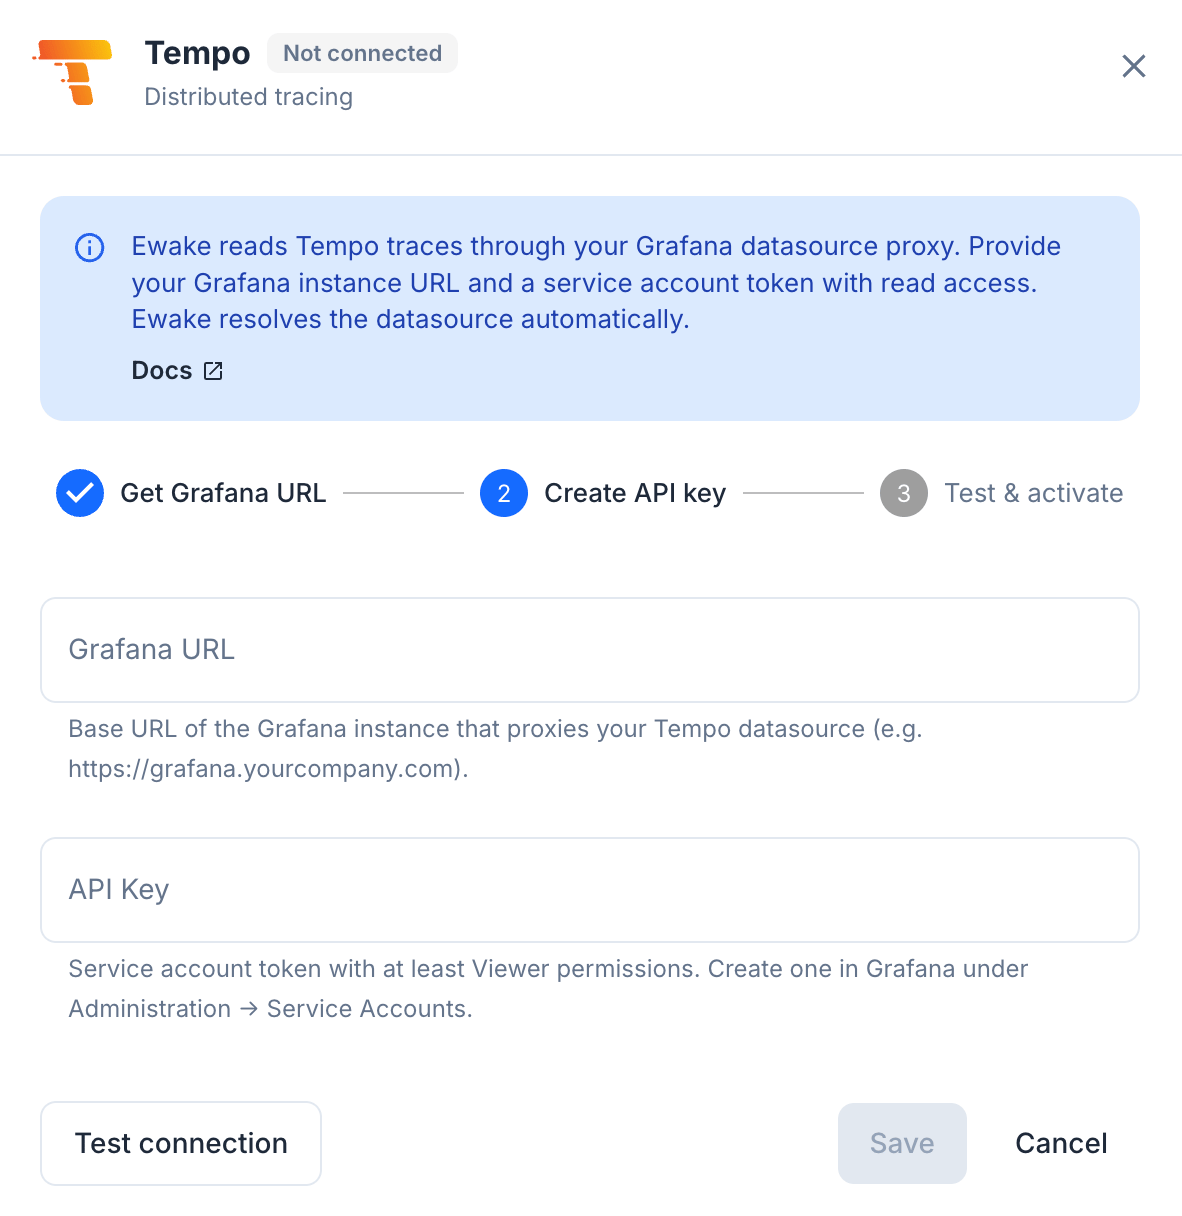
Enter your credentials
| Field | Value |
|---|---|
| Grafana URL | Base URL of the Grafana instance that proxies your Tempo data source |
| API Key | The service account token generated in Step 1 |
Ewake queries traces in read-only mode using TraceQL. It never writes spans or modifies your Tempo or Grafana configuration.